12,964 people live in Lynnfield, where the median age is 41 and the average individual income is $76,408. Data provided by the U.S. Census Bureau.
Total Population
Median Age
Population Density Population Density This is the number of people per square mile in a neighborhood.
Average individual Income
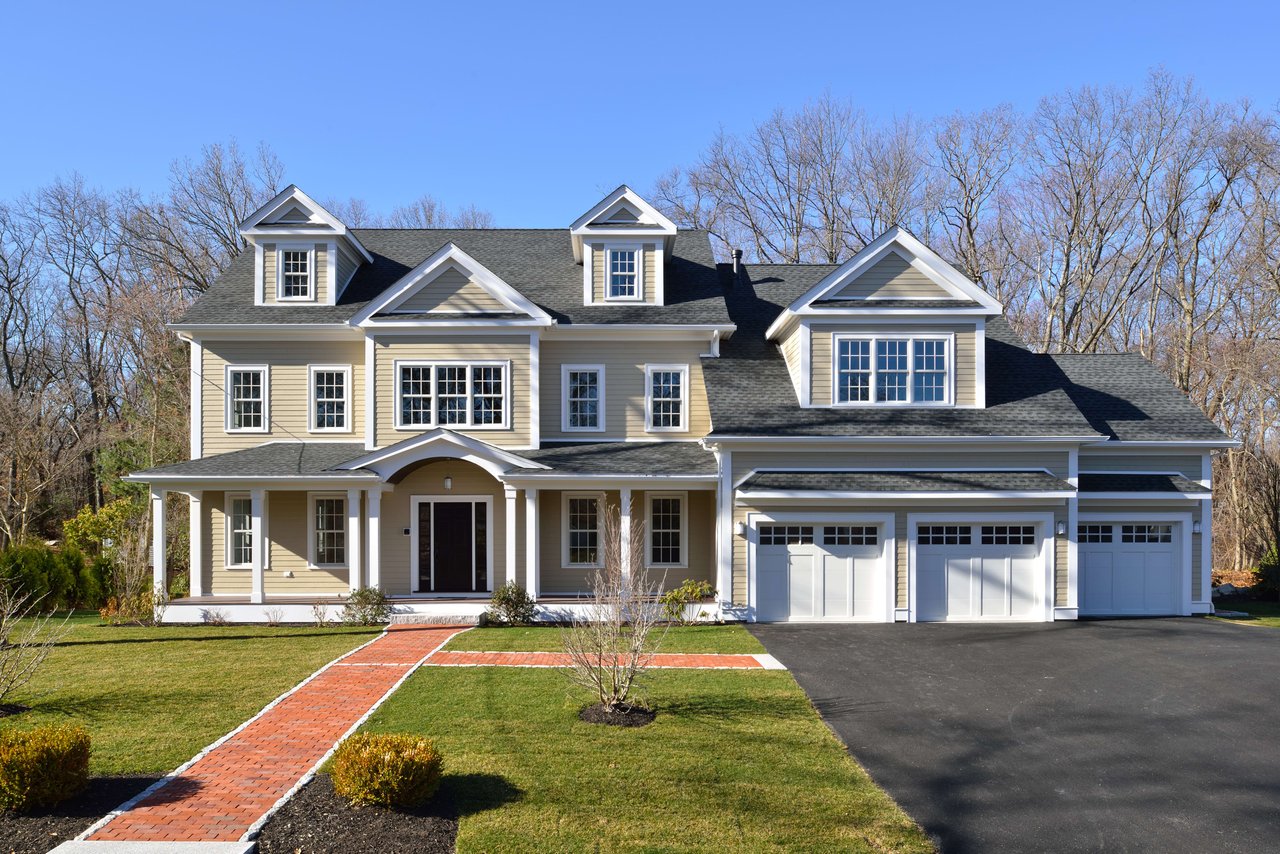
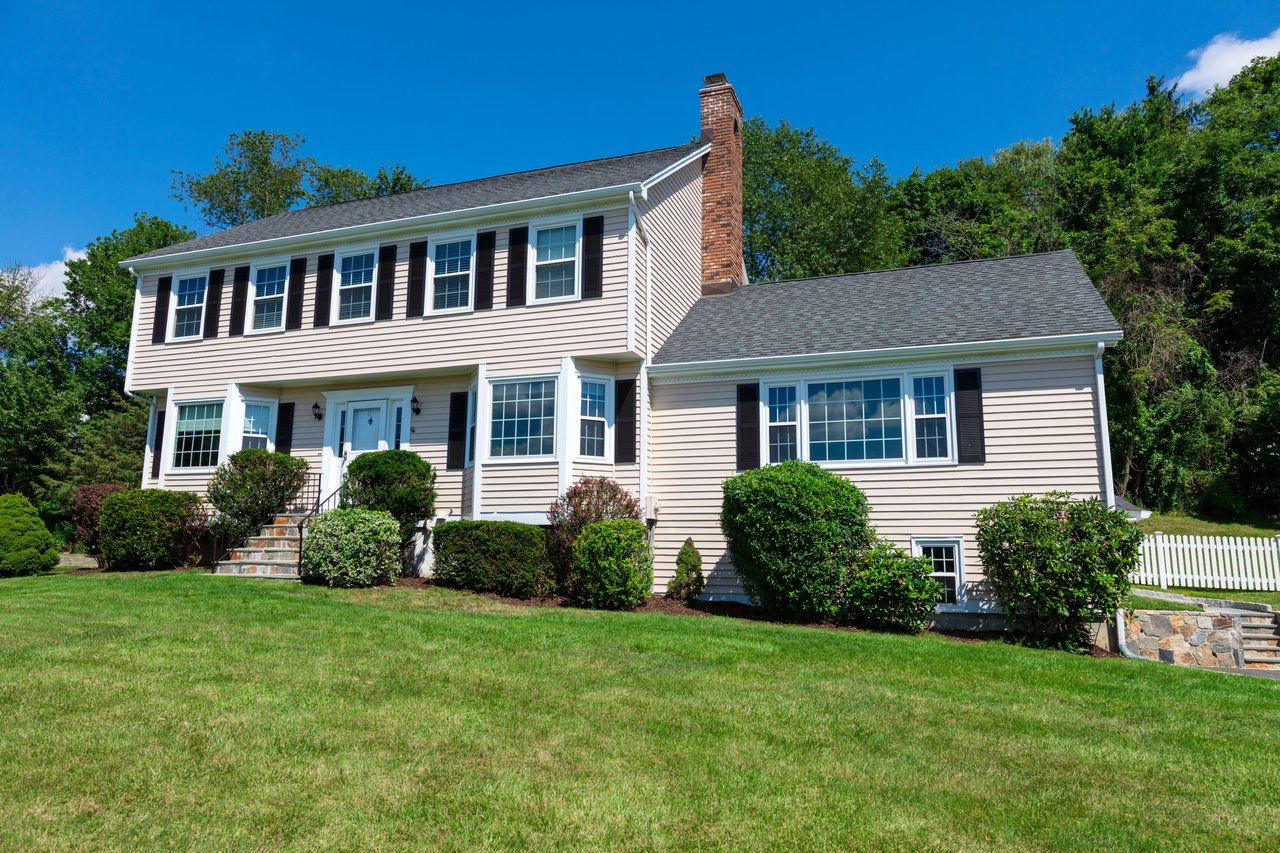
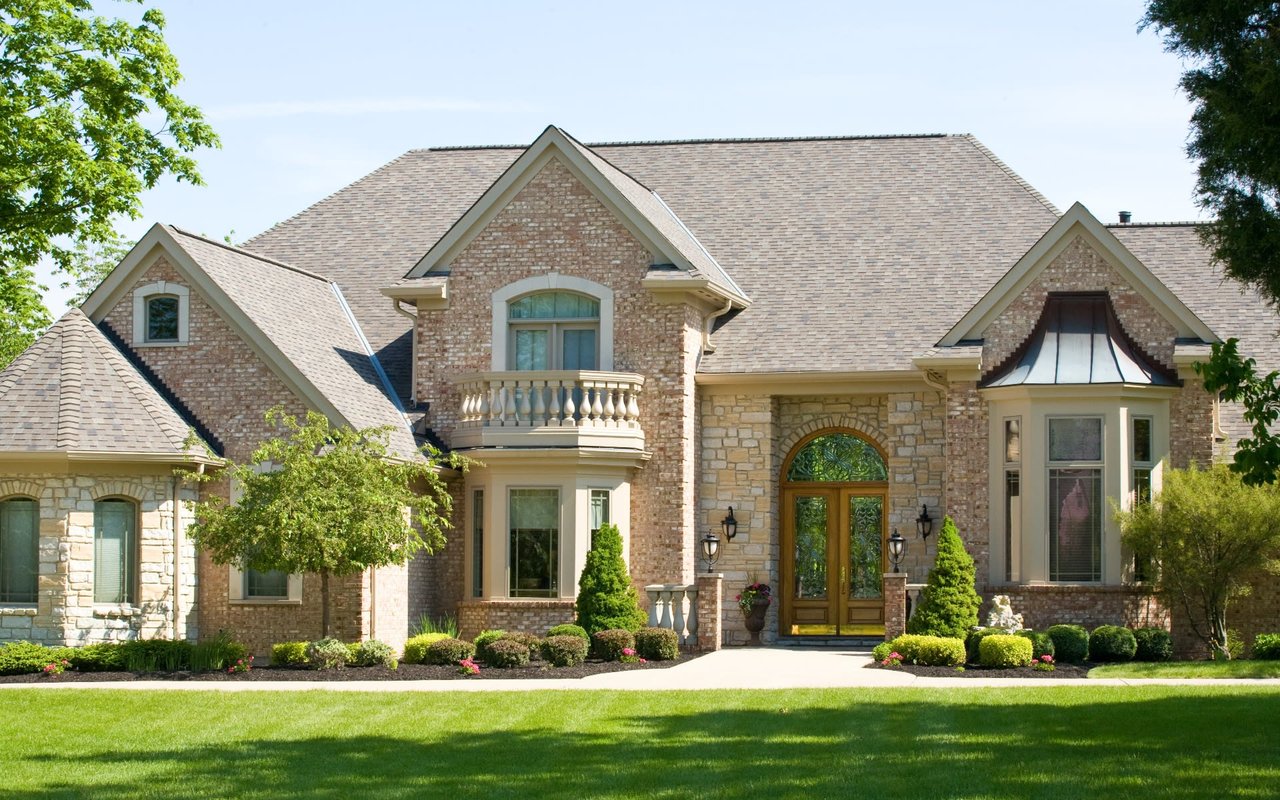
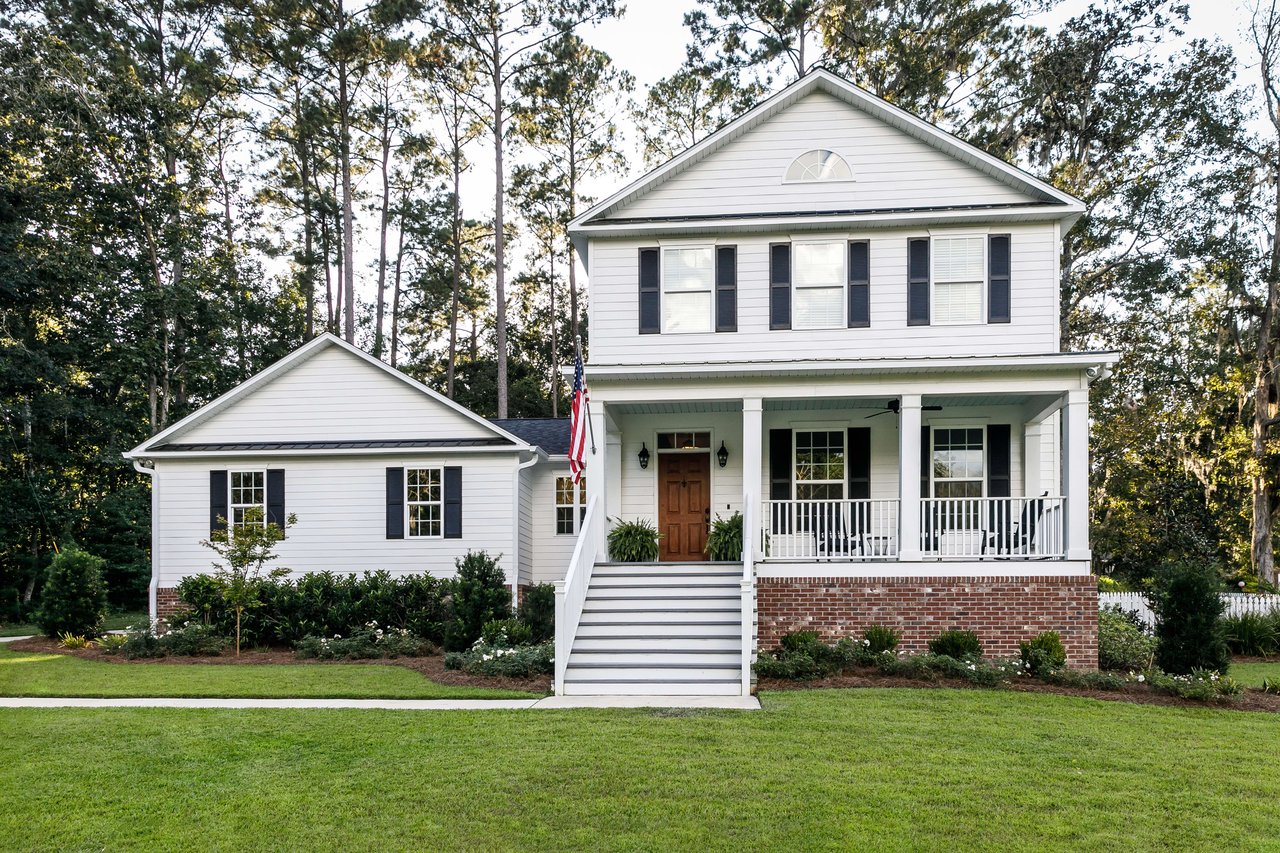
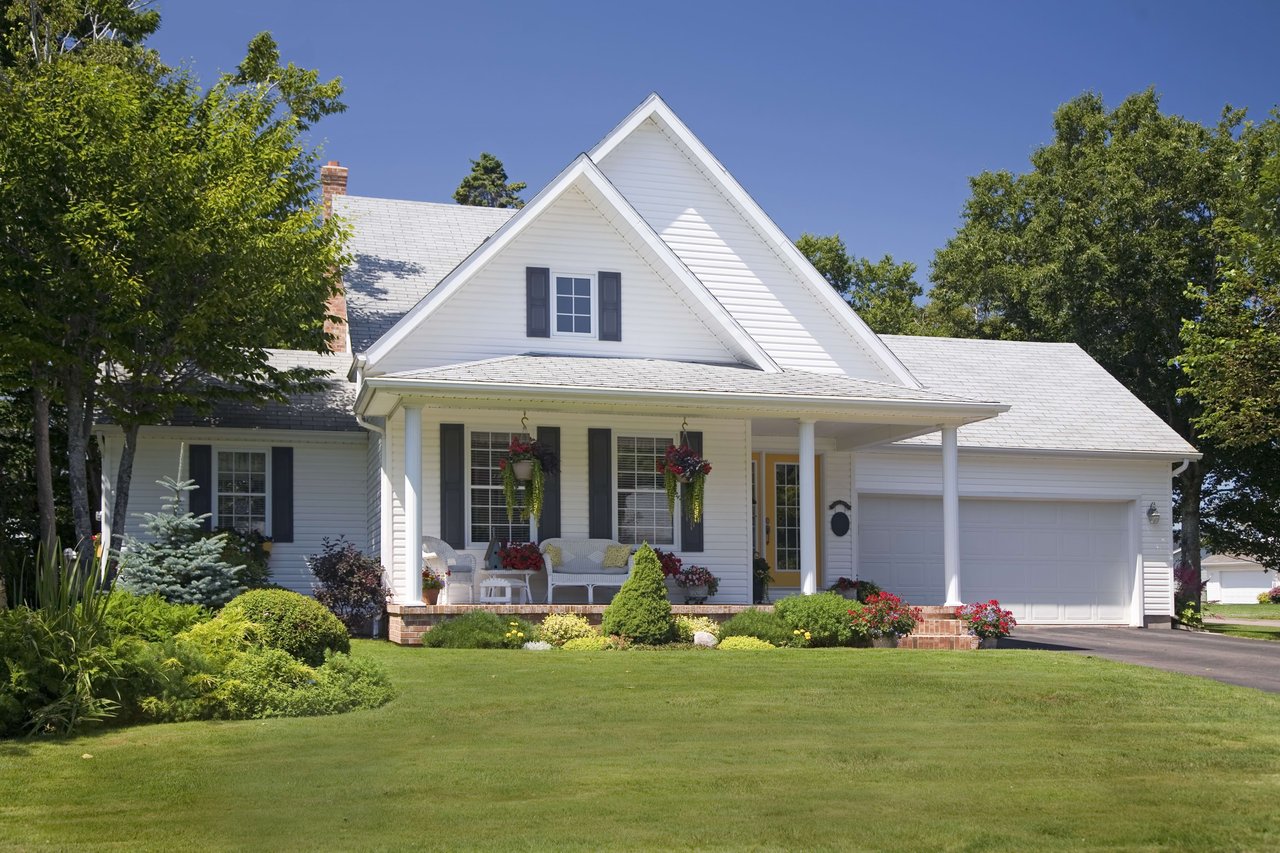
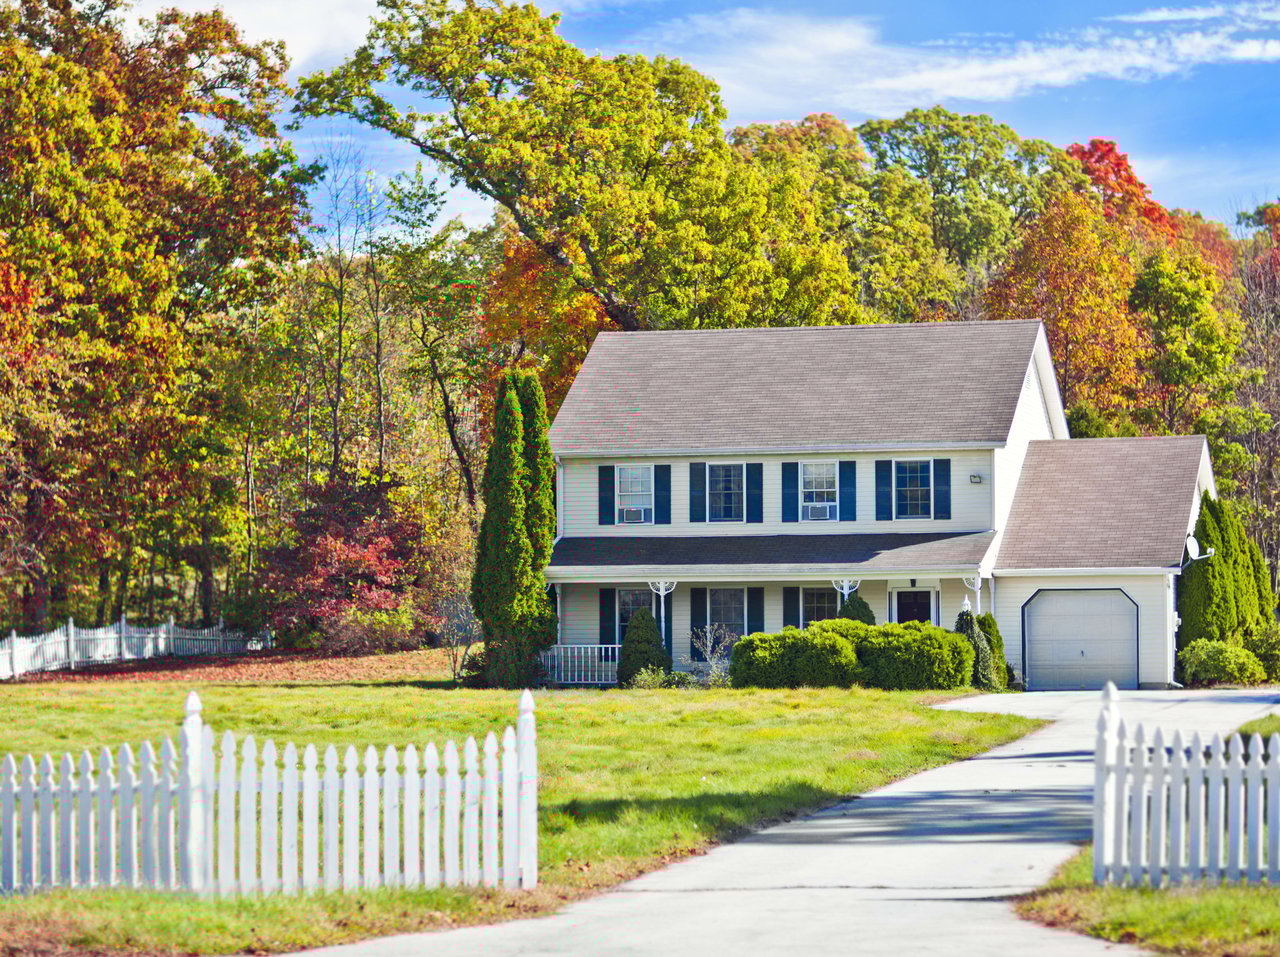
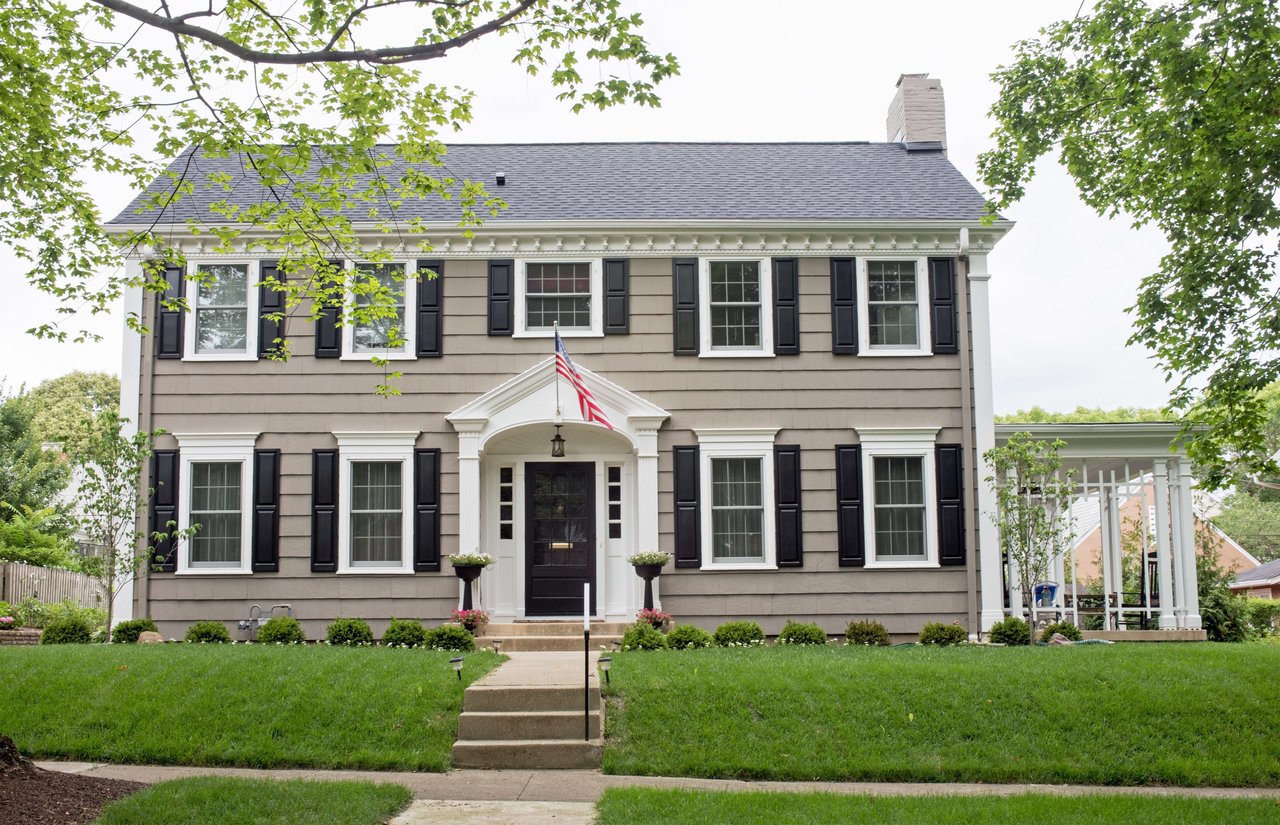
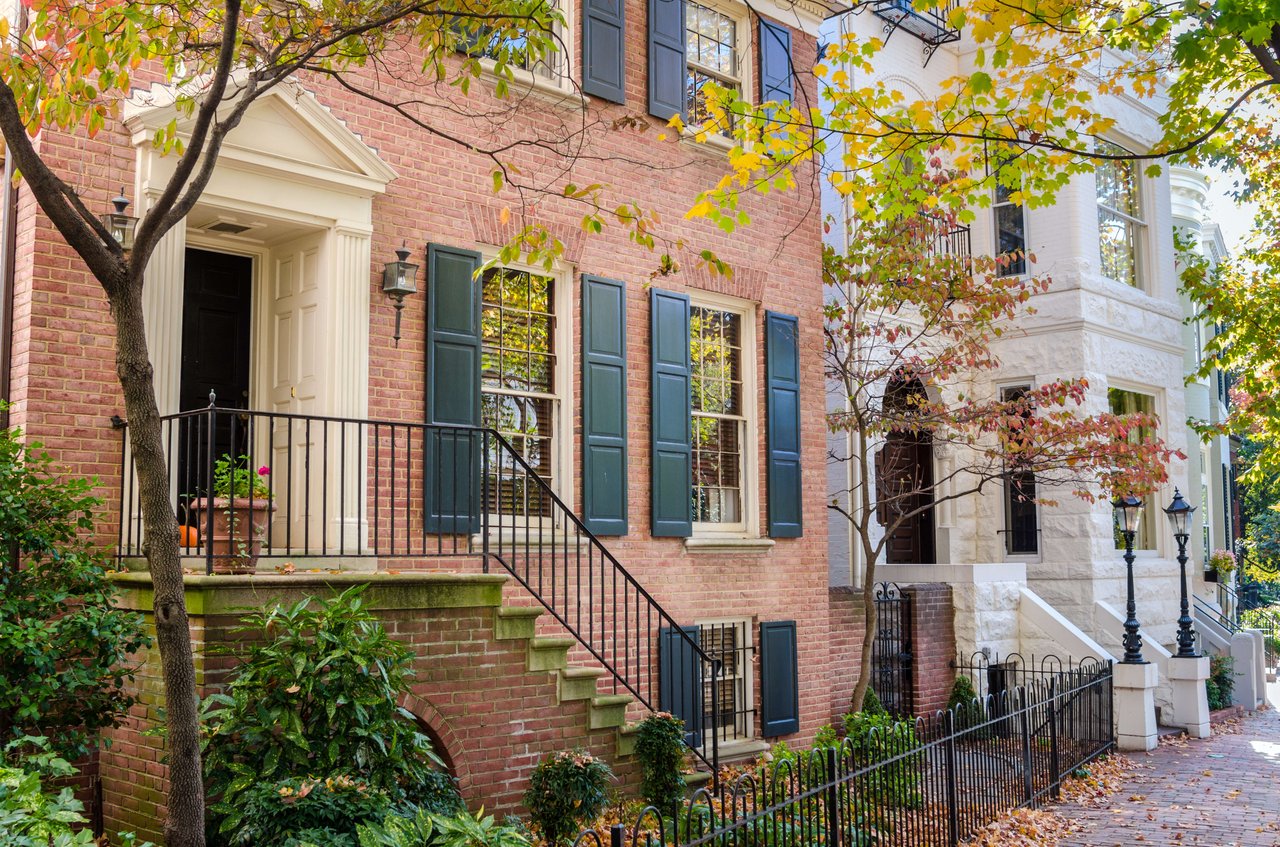
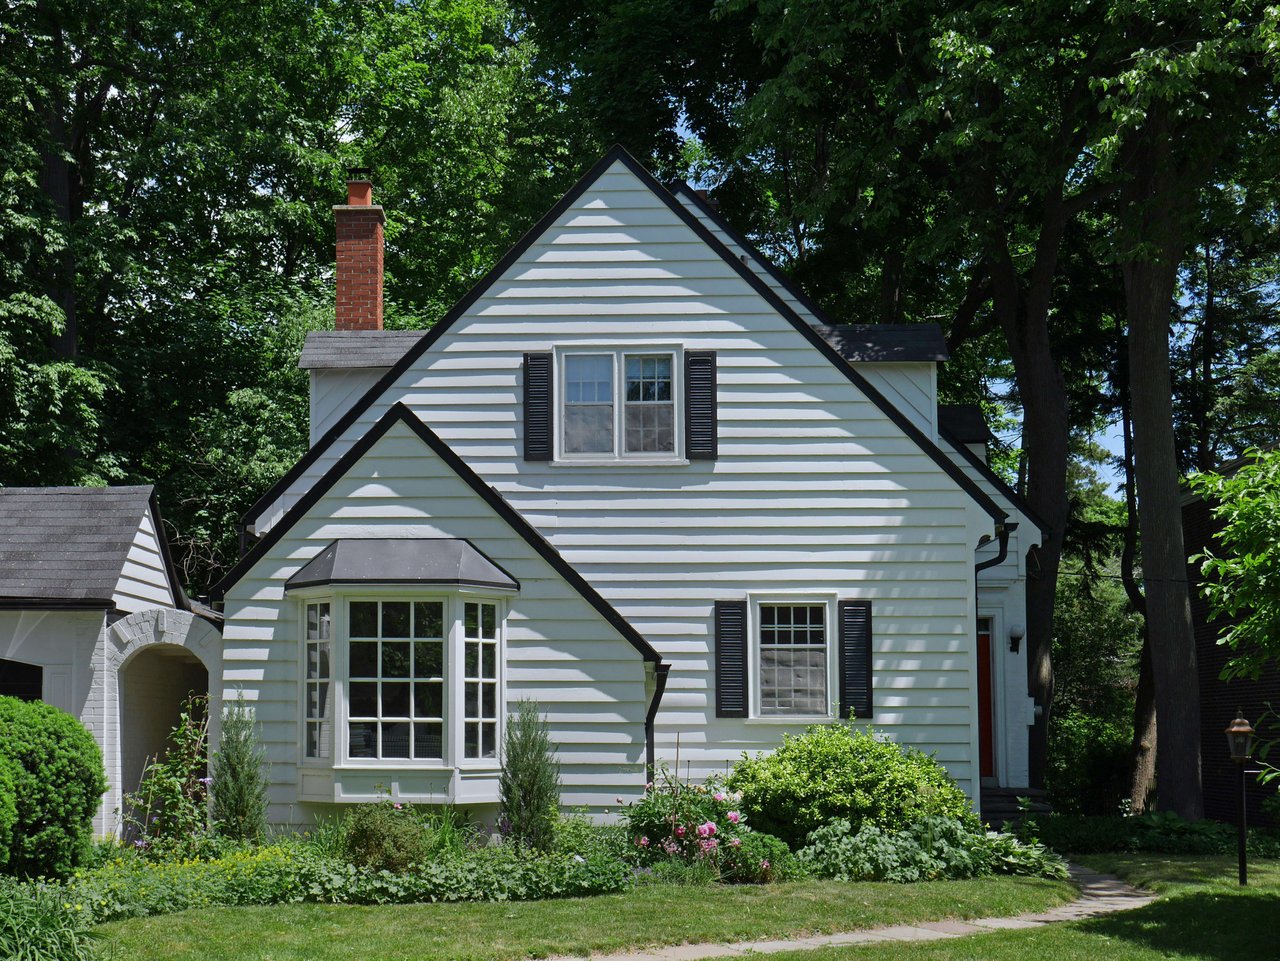
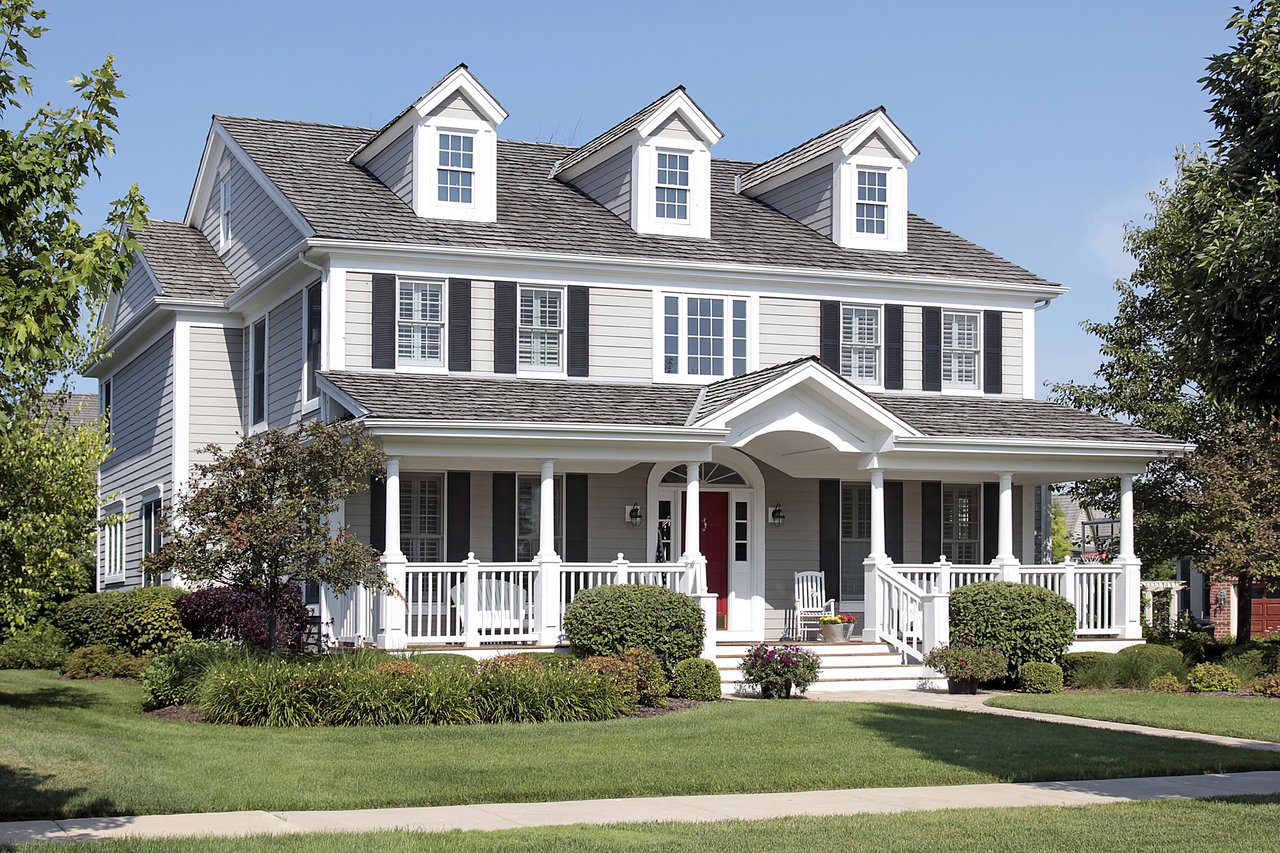
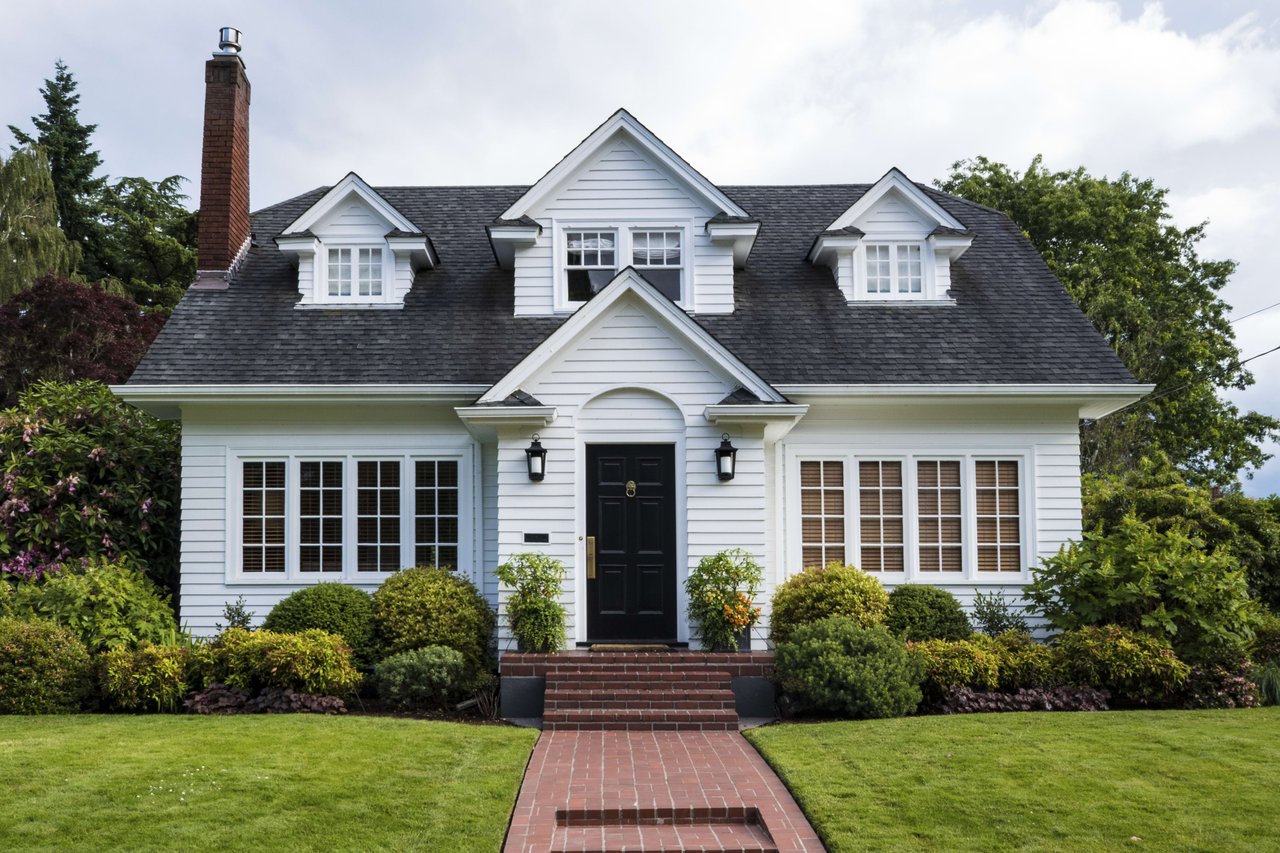
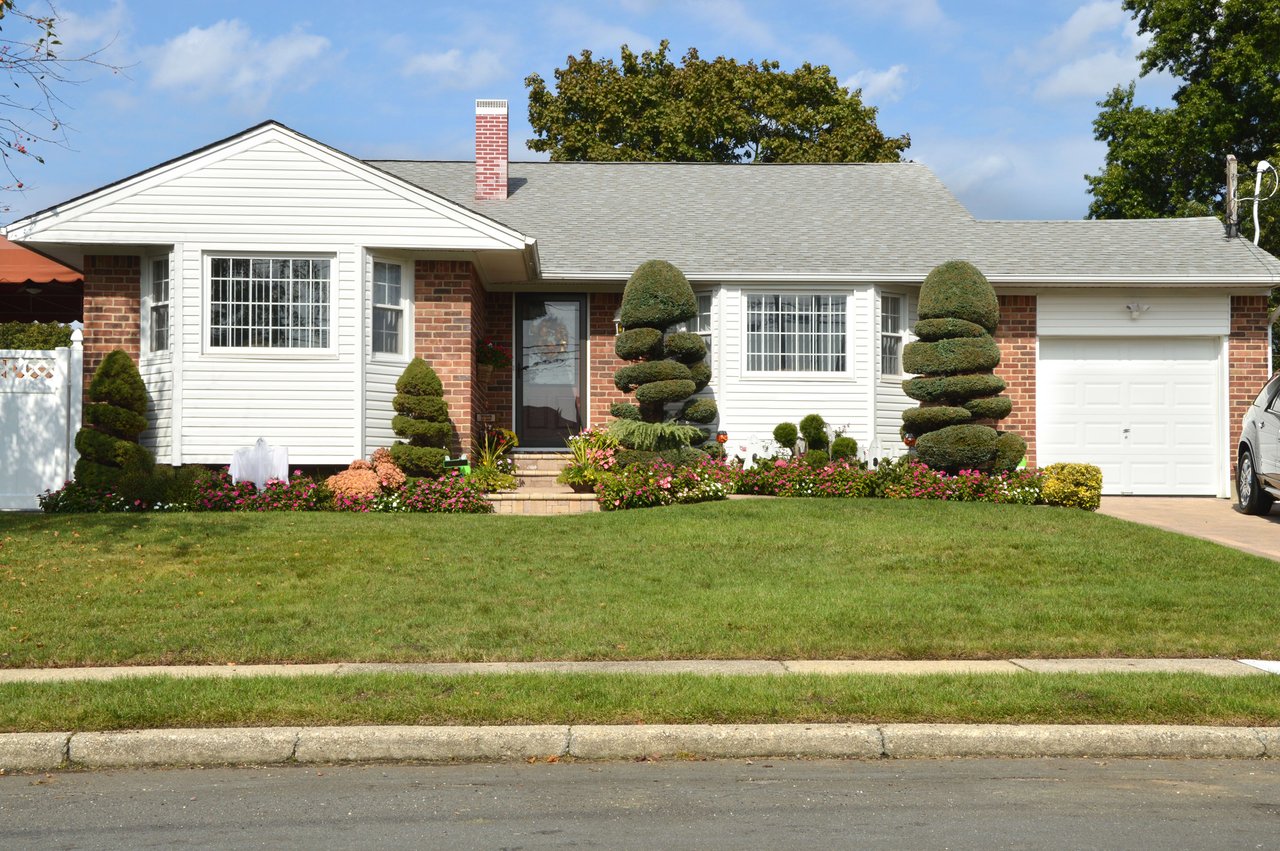
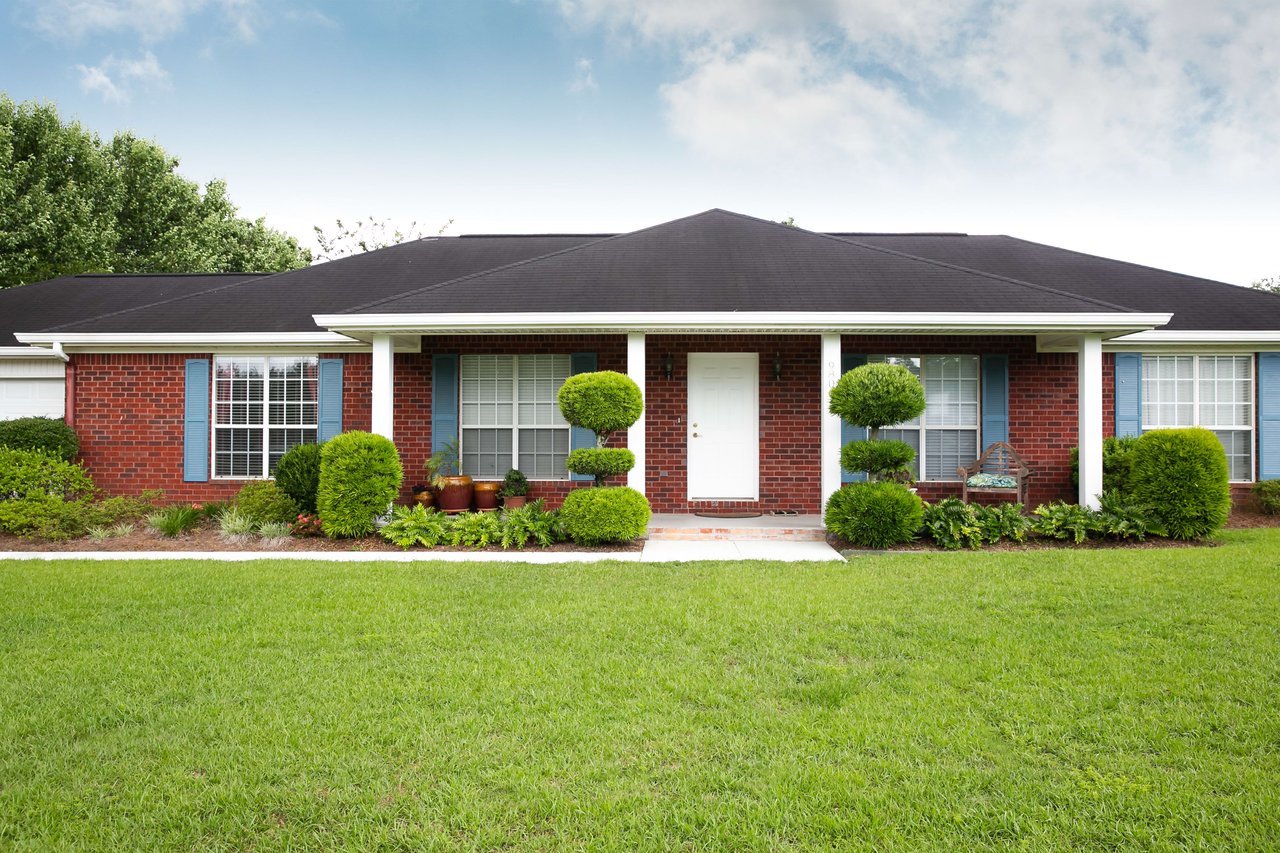
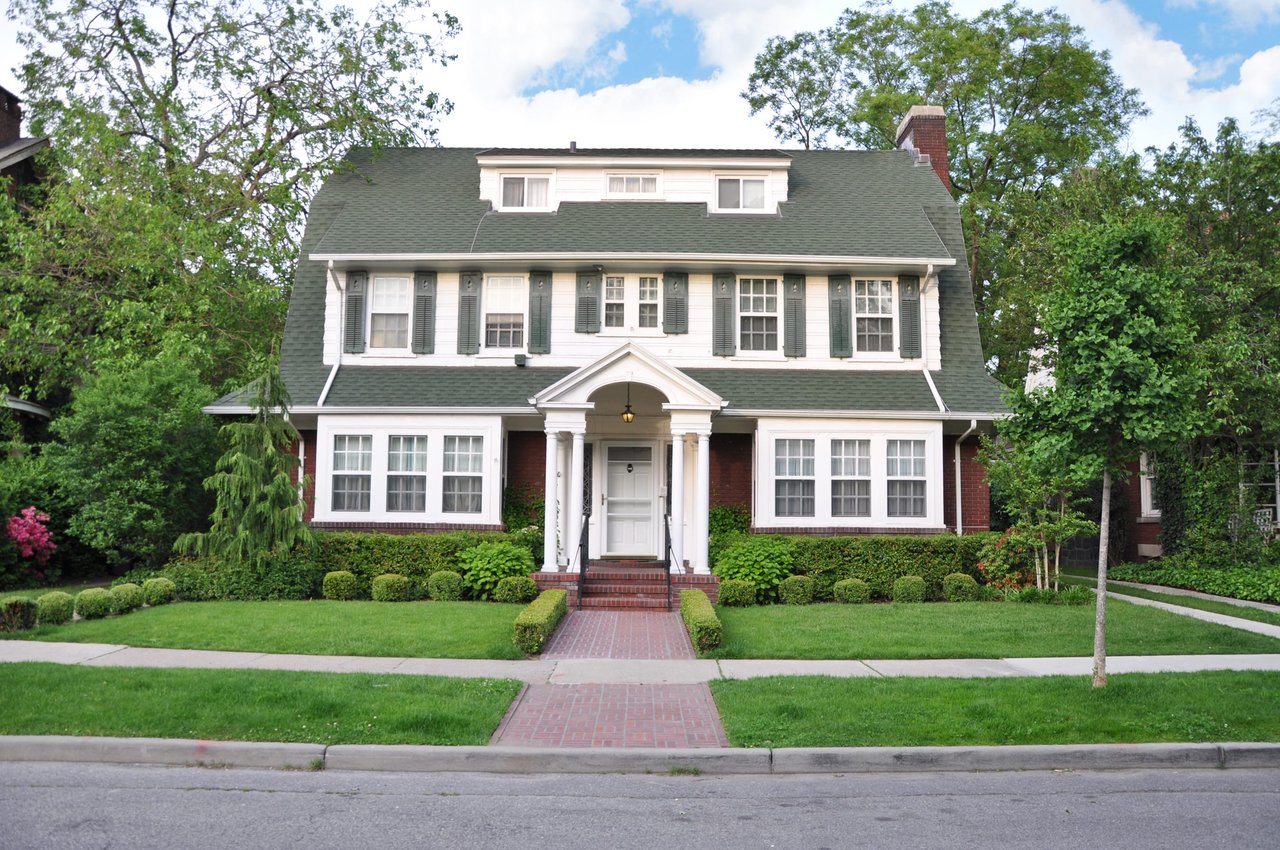
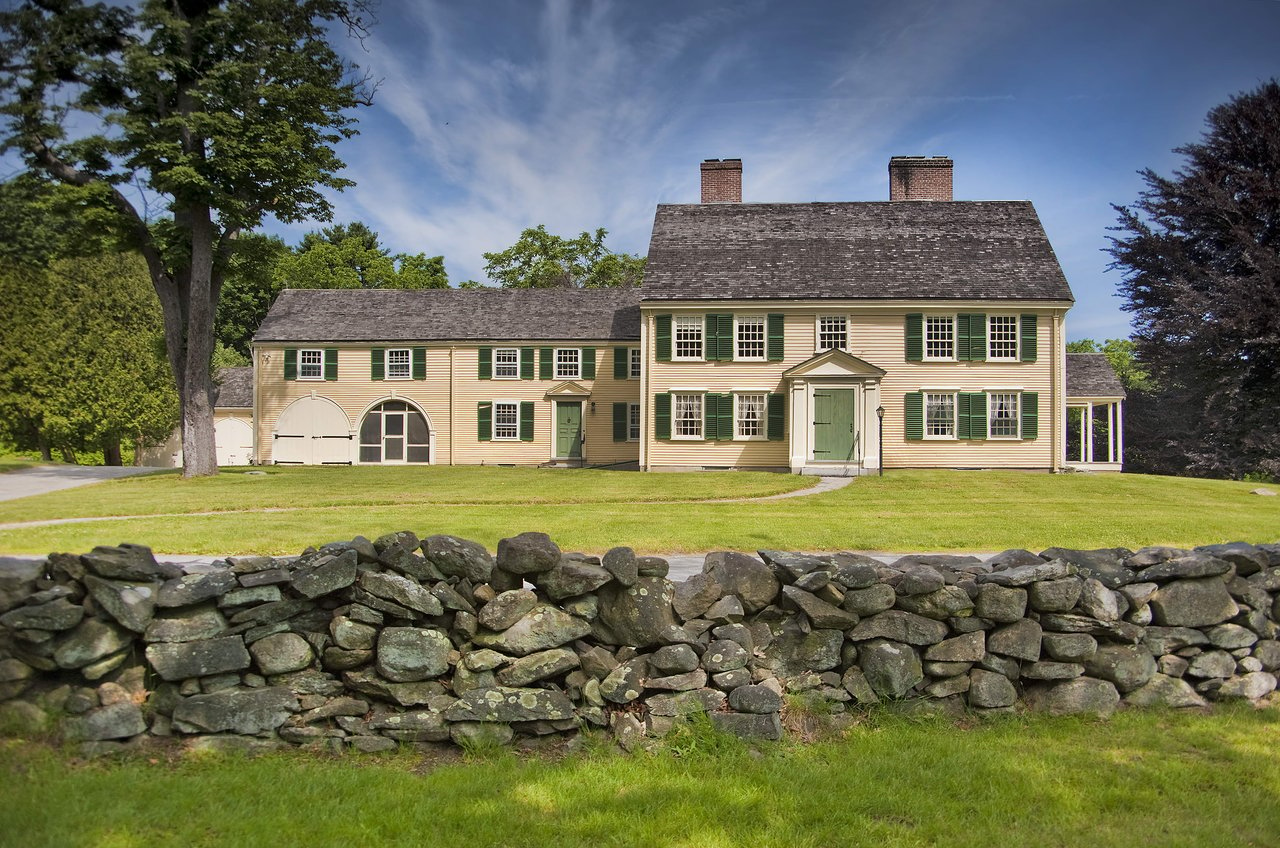
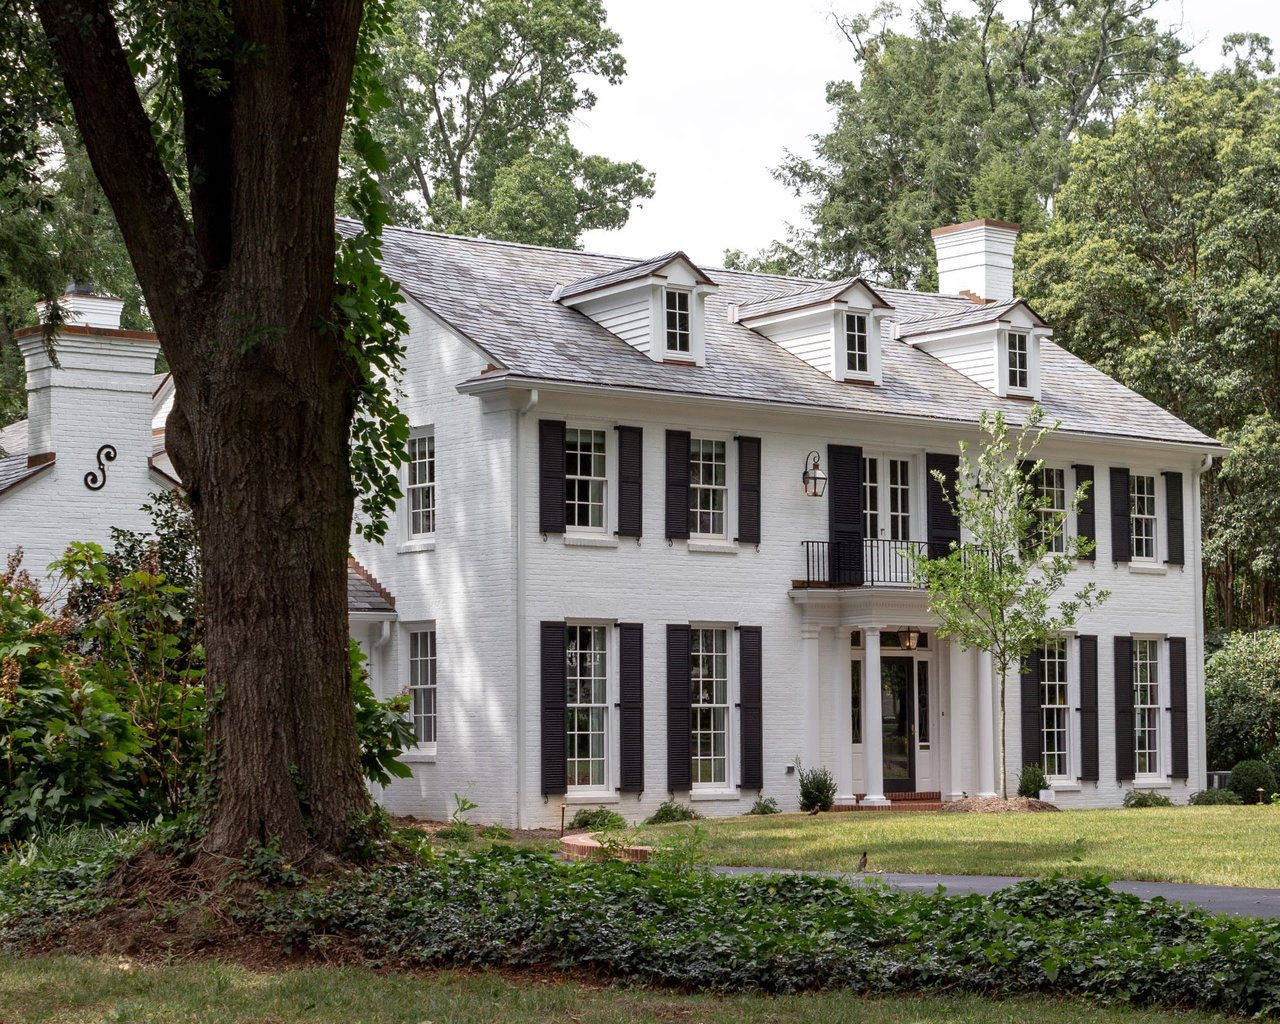
Lynnfield is a highly desirable suburban community just north of Boston, known for its upscale residential appeal and strong housing market. Real estate in Lynnfield primarily consists of single-family homes, including traditional Colonials, Cape-style residences, contemporary designs, and select new construction developments. Many properties offer generous lot sizes and well-maintained landscapes, contributing to the town’s peaceful feel.
The town’s location near I-95 and Route 1 makes commuting to Boston and surrounding employment centers convenient, while still allowing residents to enjoy a quieter suburban lifestyle. With access to outdoor recreation, a strong sense of community, and premier shopping and dining at MarketStreet Lynnfield, the town continues to attract families, move-up buyers, and long-term homeowners. Consistent demand and limited inventory help support strong property values and long-term investment potential.
Lynnfield is known for its charming suburban atmosphere, highly rated public schools, and affluent residential neighborhoods. It offers a peaceful, family-oriented environment while still providing easy access to shopping, dining, and major highways. The MarketStreet Lynnfield shopping center is a major local destination, blending retail, restaurants, and entertainment in an open-air setting.
Lynnfield has a typical New England humid continental climate, with cold, snowy winters and warm, humid summers. Spring and fall offer mild temperatures and beautiful foliage, perfect for outdoor activities. The seasonal variety makes it a great place to enjoy year-round recreational opportunities.
Lynnfield is located about 17 miles north of Boston. By car, it typically takes 25 to 35 minutes to reach downtown Boston, depending on traffic. Its proximity to I-95 and Route 1 makes commuting convenient for those working in the city or neighboring suburbs.
Yes, Lynnfield is considered one of the more desirable suburbs north of Boston. It appeals to families and professionals seeking quiet neighborhoods, excellent schools, and a strong sense of community. The town offers a blend of small-town charm and modern amenities, making it a great place to buy a homes.
Lynnfield’s real estate market features primarily single-family homes, including Colonial and Cape-style houses on spacious lots. While it has fewer condominiums and multi-family properties than nearby urban areas, newer townhome developments and upscale housing options are becoming more common, especially near MarketStreet Lynnfield.
Lynnfield has 4,621 households, with an average household size of 2.8. Data provided by the U.S. Census Bureau. Here’s what the people living in Lynnfield do for work — and how long it takes them to get there. Data provided by the U.S. Census Bureau. 12,964 people call Lynnfield home. The population density is 1,315.27 and the largest age group is Data provided by the U.S. Census Bureau.
Total Population
Population Density Population Density This is the number of people per square mile in a neighborhood.
Median Age
Men vs Women
Population by Age Group
0-9 Years
10-17 Years
18-24 Years
25-64 Years
65-74 Years
75+ Years
Education Level
Total Households
Average Household Size
Average individual Income
Households with Children
With Children:
Without Children:
Marital Status
Blue vs White Collar Workers
Blue Collar:
White Collar:
Let me assist you in making this important change in your life, making your dreams come true. Proven results through passion, expertise and integrity.
Let's Connect1085 Summer Street Lynnfield, MA 01940